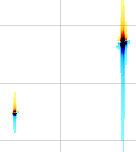
starts the engine. You need to click it twice, because it's a 2D spectrum. The engine performs weighting and the Fourier Transform. Optionally it can also perform solvent suppression and linear prediction. After the two clicks, you have the transformed spectrum, with no phase correction. All peaks look like:

Why the engine forgets to correct the phase? The intention of the engine was not to automatize all tasks. Quite simply, many operations were (almost) always performed with default parameters. It was a non-sense to perform manually exactly the same operations with the same parameters, therefore the "gears" button was introduced. Phase correction is less repetitive, instead. This is a TOCSY spectrum acquired on a Bruker Avance. The needed phase correction, in this particular case, is well known. Click the icon for manual phase correction:

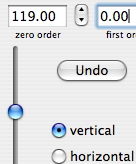
When the dialog appears, enter the values below:

These values are the ones most frequently used, for many kinds of experiments. Another frequent combination is: 9O; 180. We can say the phase is OK along the horizontal dimension (f1, in this case), because all the peaks appear as thin vertical stripes.

The purpose of phase correction is to have narrow peaks. In order to have our peaks narrow along both directions, we select the "vertical" radio button, as in the picture:

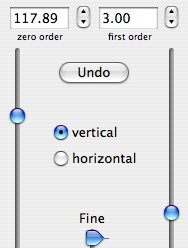
Move the left slider until the zero order correction is = 119 degrees. You should notice an improvement in the center of the spectrum. We don't want to lose this local improvement. Pressing the "alt" key, click near 5 ppm. This mark appears:

It fixes the pivot point. Now the first order phase correction cannot change the row at 5.142 ppm. Press the key "+" to enhance all peaks. Those in the upper-right corner are still not symmetric because they have both positive (red) and negative (blue) tails.

We only need a small adjustment. Move the central slider to "Fine".

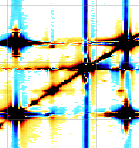
Monitor the situation along the diagonal. The central peak in the figure below is optimal for monitoring, because there is no cross-peak near it. When both tails have the same color, the phase is perfect.

Such easy examples are quite common. They are ideal for training. Try altering the phase and correcting it again. The experience you gain in this way will be precious for tackling more difficult cases.
No comments:
Post a Comment